Global E-Bike Market Landscape (2025)
The worldwide electric bike market continues its remarkable trajectory, with 2025 projections showing an 8.44% compound annual growth rate from 2024. This sustained expansion reflects the increasing acceptance of e-bikes as legitimate transportation alternatives across diverse global markets.
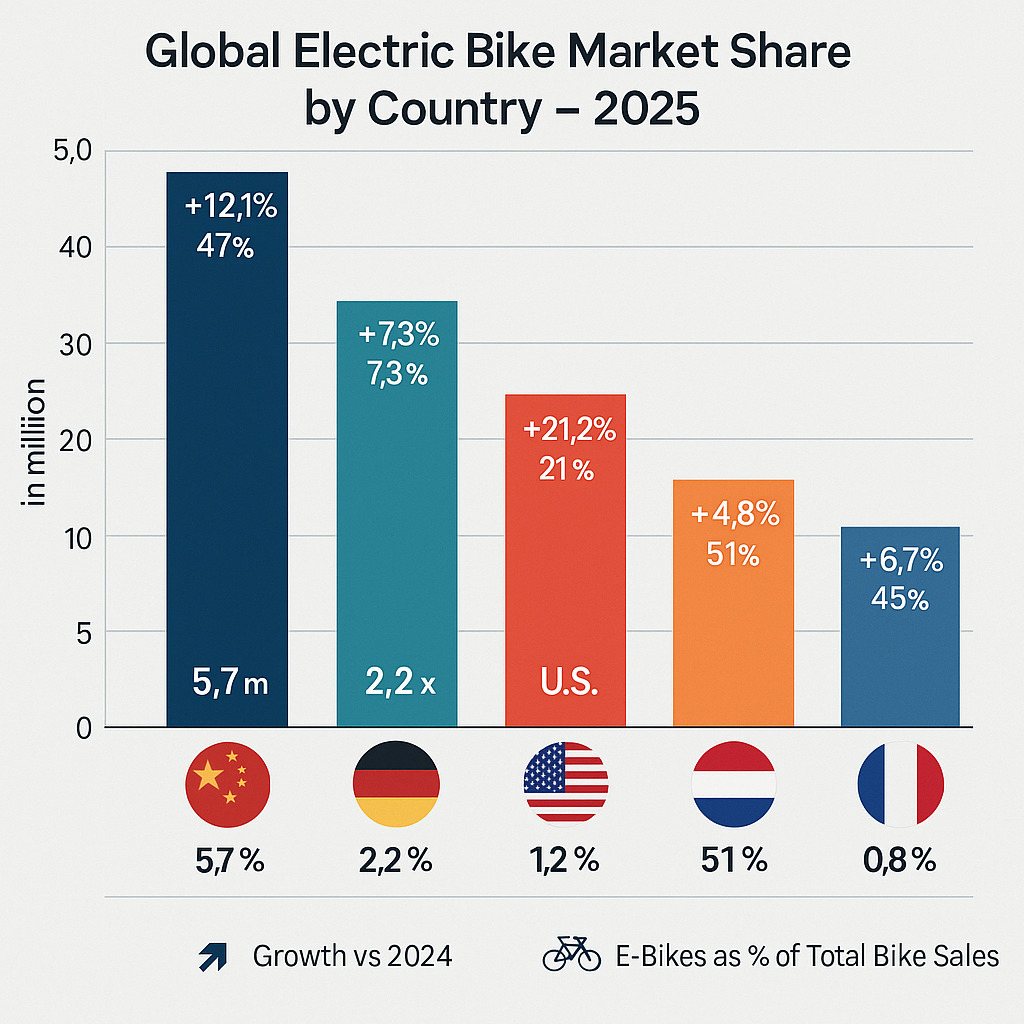
Top Global Markets by Sales Volume
| Country | 2025 Projected Units | Growth vs 2024 | E-Bikes as % of Total Bike Sales |
| Germany | 2.2 million | +7.3% | 53% |
| Netherlands | 1.1 million | +4.8% | 51% |
| China | 5.7 million | +12.1% | 47% |
| USA | 1.2 million | +21.2% | 18% |
| France | 0.8 million | +6.7% | 45% |
Best-Selling E-Bike Categories Globally
According to the 2025 Global E-Mobility Report, commuter and city models continue to dominate the market, particularly in urban-centric European countries. However, the fastest growth is occurring in the cargo e-bike segment, which saw a remarkable 39% increase in Austria and similar trends across other developed markets.
Commuter/City E-Bikes
Representing 42% of global sales, these practical models focus on comfortable upright riding positions, integrated lights, and mudguards for daily use.
E-MTBs
Making up 35% of the market, electric mountain bikes continue to attract enthusiasts with powerful motors reaching 85-100Nm torque ratings.
Cargo E-Bikes
The fastest-growing category at 9% of total sales, cargo models are increasingly adopted by families and delivery services as car replacements.
Market Drivers in 2025
Several key factors are propelling the continued expansion of the global electric bike market in 2025:
- Urban congestion policies, including low-emission zones and congestion charges in major cities
- Integration with broader electric vehicle culture and infrastructure development
- Climate action commitments driving institutional and corporate fleet transitions
- Technological advancements in battery efficiency, with average ranges now exceeding 80 miles
- Rising fuel costs are making e-bikes increasingly economical compared to cars
Stay Updated with E-Bike Market Trends
Subscribe to our newsletter for quarterly reports on the latest electric bike statistics, technology developments, and market projections.
UK Electric Bike Market Analysis (2025)
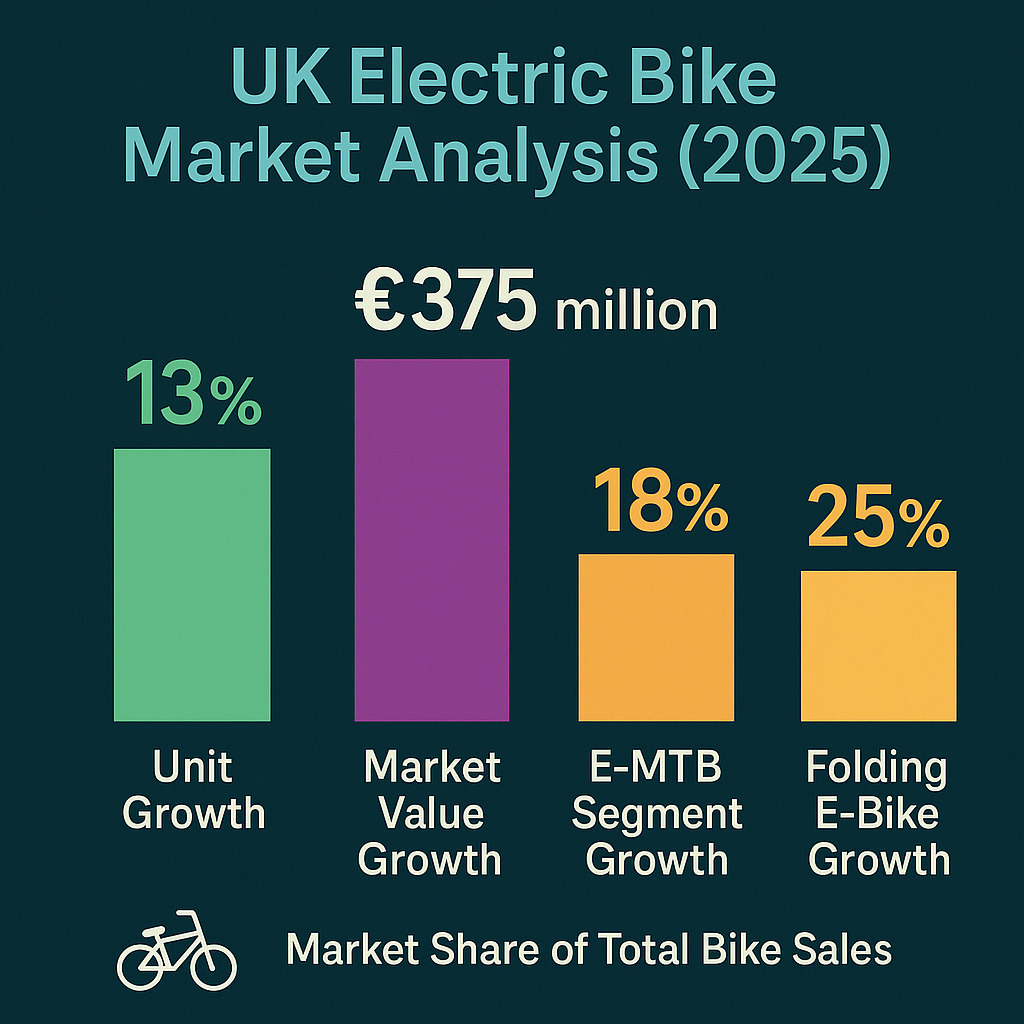
After several challenging years, the UK e-bike market is showing promising signs of recovery in 2025. According to the Bicycle Association’s latest report, sales volumes are projected to reach 165,000 units this year, representing a 13% increase from 2024’s 146,000 units.
UK Market Value and Growth
The total value of the UK electric bike market is expected to reach £375 million in 2025, representing a 21% increase from 2024. This disproportionate value growth compared to unit sales reflects a shift toward higher-quality products as consumer confidence in the technology increases.
UK Buyer Demographics
The profile of UK e-bike buyers continues to evolve in 2025, with several notable trends emerging:
Age Distribution
- 35-54 age group: Represents 42% of all UK e-bike purchases
- 55+ age group: Accounts for 31% of sales, with health benefits cited as primary motivation
- 25-34 age group: Fastest growing segment at 18% of market, primarily urban commuters
- Under 25: Limited to 9% of the market due to affordability constraints
Regional Hotspots
- London: 32% of UK e-bike sales, driven by congestion charge avoidance
- Manchester: 18% of sales, benefiting from expanded cycling infrastructure
- Bristol: 14% of the market, with strong local government support
- Edinburgh: 11% of sales despite challenging topography, demonstrating e-bikes’ appeal for hilly cities
Most Popular E-Bike Types in the UK
Unlike continental Europe, where e-MTBS dominate many markets, the UK shows a stronger preference for practical, commuter-focused models:
Commuter E-Bikes
Representing 48% of UK sales, these practical models dominate urban markets with their versatility and value proposition.
Folding E-Bikes
Making up 22% of the market, folding models are particularly popular in London, where storage space is limited and theft concerns are high.
E-MTBs
At 17% of sales, electric mountain bikes are growing but remain behind European adoption rates, concentrated in rural and suburban areas.
UK Purchase Motivators
According to a 2025 survey by Cycling UK, the primary motivations for e-bike purchases in the UK have shifted slightly from previous years:
Top Purchase Motivators
- Commuting cost savings vs. public transport (cited by 68% of buyers)
- Health benefits with accessible exercise (61%)
- Environmental concerns and carbon footprint reduction (57%)
- Avoiding traffic congestion in urban areas (52%)
- Cycle to Work scheme financial benefits (43%)
Primary Purchase Barriers
- Initial purchase cost (cited by 72% of non-buyers)
- Concerns about secure parking and theft (65%)
- Perceived lack of cycling infrastructure (58%)
- Battery range anxiety (41%)
- Confusion about legal requirements and restrictions (37%)
E-Bike Usage Trends in 2025
How e-bikes are being used continues to evolve, with several distinct patterns emerging in the UK market throughout 2025.
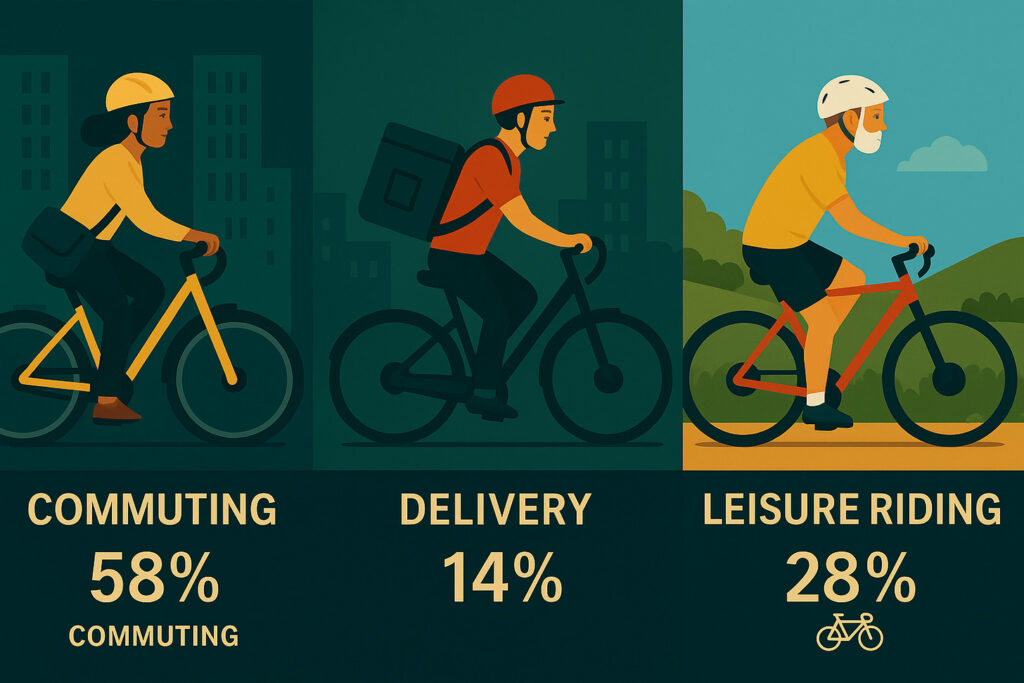
Primary Use Cases
Commuting
Represents 58% of e-bike usage in the UK, with the average e-bike commute distance increasing to 7.8 miles in 2025, up from 6.2 miles in 2023. This extension of practical commuting range demonstrates the technology’s growing capability.
Delivery Services
The fastest-growing segment is at 14% of usage, with major platforms like Deliveroo reporting that 35% of their UK fleet now uses e-bikes. The gig economy continues to drive significant adoption in urban centres.
Leisure Riding
Making up 28% of usage, recreational riding has seen increased popularity with older demographics, who appreciate the assistance on longer rides and challenging terrain.
Cycle to Work Scheme Participation
The UK’s Cycle to Work scheme continues to be a significant driver of e-bike adoption, with 2025 seeing important developments:
“The expansion of the Cycle to Work scheme’s price cap to £5,000 in late 2024 has been transformative for the e-bike market, opening up premium models to salary sacrifice benefits and driving a 27% increase in scheme participation for electric bikes.”
- 43,500 e-bikes purchased through the scheme in 2025 (projected)
- Average value of £2,850 per e-bike, up 18% from 2024
- 85% of participating employers now offer the full £5,000 cap
- 27% increase in scheme participation for e-bikes following the cap increase
Shifting Attitudes Toward Car Ownership
A significant trend in 2025 is the changing relationship between e-bike and car ownership, particularly in urban areas:
According to Transport for London’s 2025 Mobility Survey, 32% of urban e-bike owners report significantly reduced car usage, while 18% have sold a household vehicle after purchasing an electric bike.
This shift is particularly pronounced among younger demographics, with 41% of e-bike owners aged 25-34 in London reporting they have delayed or abandoned plans to purchase a car due to their e-bike meeting most transportation needs.
Environmental & Economic Impact
The growing adoption of electric bikes continues to deliver measurable environmental and economic benefits across the UK.
Carbon Emissions Reduction
The environmental impact of e-bike adoption is becoming increasingly quantifiable as usage patterns stabilise:
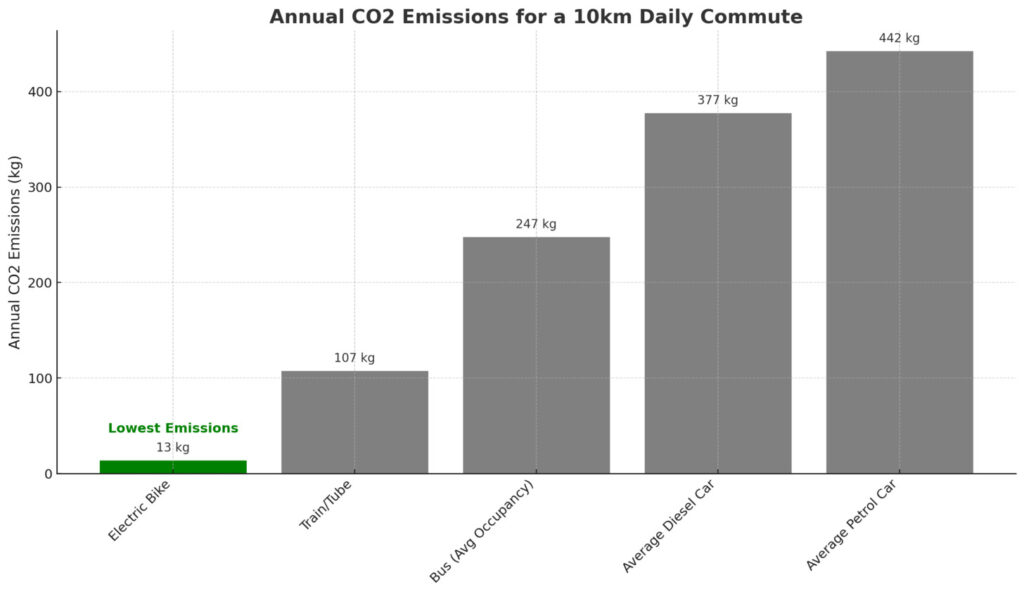
| Transport Mode | CO2 Emissions (g/km) | Annual CO2 for 10km Daily Commute (kg) |
| Electric Bike | 5 | 13 |
| Bus (Average Occupancy) | 95 | 247 |
| Train/Tube | 41 | 107 |
| Average Petrol Car | 170 | 442 |
| Average Diesel Car | 145 | 377 |
Based on current usage patterns, the UK’s e-bike fleet is estimated to have prevented approximately 28,500 tonnes of CO2 emissions in 2025, equivalent to removing 6,200 cars from the road.
Supporting Net-Zero Goals
The UK government’s commitment to reach net-zero emissions by 2050 has placed increased focus on sustainable transport solutions. The Department for Transport’s 2025 Decarbonisation Strategy specifically highlights e-bikes as a critical component in reducing short-journey emissions, which account for over 60% of all UK trips.
The UK government’s updated Transport Decarbonisation Plan includes a target for 10% of all urban journeys to be made by e-bikes by 2030, requiring approximately 1.5 million active e-bikes on UK roads.
Financial Benefits for Users
The economic case for e-bike adoption continues to strengthen in 2025, particularly as fuel and public transport costs rise:
- Average annual savings vs. car commuting: £1,750 (based on 10-mile round trip)
- Average annual savings vs. public transport: £1,200 (based on zone 1-3 London commute)
- Typical e-bike running costs: £0.13 per 10 miles (electricity) plus £120 annual maintenance
- Average payback period vs. car: 18 months for £2,500 e-bike
Calculate Your Potential Savings
Use our e-bike calculator to see how much you could save by switching from car or public transport to an electric bike for your daily commute.
Economic Impact on the Cycling Industry
The growth of the e-bike market continues to transform the UK cycling industry:
Retail Impact
- E-bikes now represent 42% of revenue for specialist bike retailers
- The average transaction value has increased by 28% since 2023
- Service department revenue up 35% due to e-bike maintenance
Employment Effects
- 15% increase in specialist technician jobs since 2023
- Growth in e-bike-specific retail positions
- Expansion of UK-based assembly operations
2025 UK Industry Trends
Several key trends are shaping the UK electric bike landscape in 2025, driving innovation and expanding the market’s reach.
Rise of Cargo E-Bikes
The cargo e-bike segment is experiencing remarkable growth in the UK, expanding by 42% in 2025 according to the Bicycle Association. This growth is driven by both family users and commercial applications:
Family Use
- School run applications replacing second cars
- Weekend leisure and shopping trips
- An average cargo e-bike displaces 78 car trips annually
Commercial Applications
- Last-mile delivery services are expanding rapidly
- Municipal services adoption (park maintenance, mail delivery)
- Small business local delivery solutions
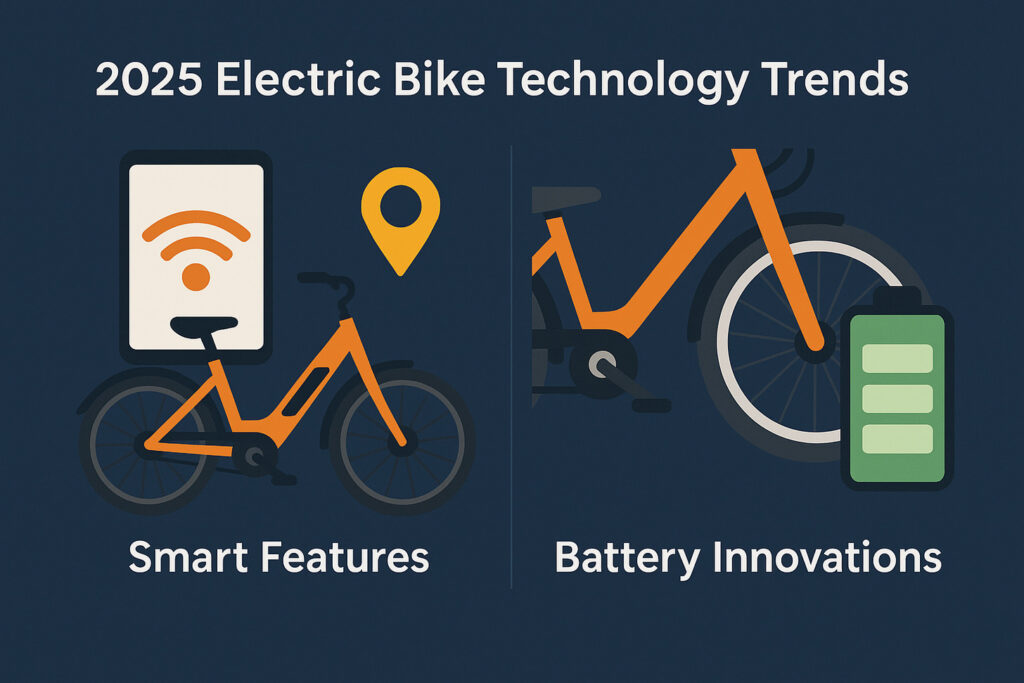
Smart Technology Integration
The integration of smart technologies is rapidly becoming standard on mid to high-end e-bikes in 2025:
Connected Apps
Over 65% of e-bikes above £2,000 now feature smartphone connectivity, offering ride tracking, diagnostics, and customizable motor settings.
Anti-Theft Technology
GPS tracking, motion alerts, and remote immobilization features are addressing security concerns, with insurance discounts available for equipped models.
Smart Navigation
Integrated displays with cycling-specific navigation are becoming standard, with some premium models offering augmented reality features through heads-up displays.
Battery Technology Advancements
Battery technology continues to evolve rapidly, addressing previous limitations:

- Extended Range: Average range increased to 80 miles per charge for commuter models
- Fast Charging: New standards enabling 80% charge in under 1 hour
- Weight Reduction: 15% average weight reduction since 2023 models
- Battery Health: Improved management systems extending useful life to 1,000+ charge cycles
- Removable Design: 82% of models now feature easily removable batteries for convenient charging
Subscription and Leasing Models
New ownership models are emerging to address affordability concerns:
“The shift toward subscription models is democratizing access to quality e-bikes, with 22% of new UK e-bike acquisitions now coming through flexible ownership programs rather than outright purchase.”
Major retailers and independent startups are offering monthly subscription packages ranging from £49-£99, typically including maintenance and insurance. These models are particularly popular with younger urban users who value flexibility and minimal upfront commitment.
E-Bike Tourism Growth
The tourism sector is embracing electric bikes as a key offering:
- 78% of UK cycling tourism operators now offer e-bike options
- Average rental duration increased by 2.3 hours compared to traditional bikes
- National parks reporting a 35% increase in cycling visitors, primarily on e-bikes
- Specialised e-bike tourism routes are being developed with charging infrastructure

Challenges Facing the UK E-Bike Market in 2025
Despite the positive growth trajectory, several significant challenges continue to impact the UK electric bike market in 2025.
Affordability and VAT Concerns
Price remains the single largest barrier to wider adoption:
Despite industry campaigns, electric bikes continue to attract the full 20% VAT rate in the UK, unlike electric cars which benefit from reduced VAT incentives. This disparity adds approximately £400-£500 to the cost of a typical £2,500 e-bike.
Industry associations continue to lobby for VAT reduction to 5% for electric bikes, arguing they deliver greater environmental benefits per pound spent than electric cars. The 2025 Spring Budget indicated potential for review, but no concrete timeline has been established.
Regulatory Confusion
The legal framework surrounding e-bikes continues to create confusion for consumers:
- Speed Pedelecs: Confusion around 28mph models that require registration and insurance
- Imported Models: Non-compliant imports create safety and legal concerns
- Power Limits: Ongoing debate about the 250w power restriction vs. European alternatives
- Off-Road Use: Unclear regulations regarding e-MTB use on various trail classifications
A 2025 survey by Cycling UK found that 37% of potential e-bike buyers cited confusion about legal requirements as a significant barrier to purchase.
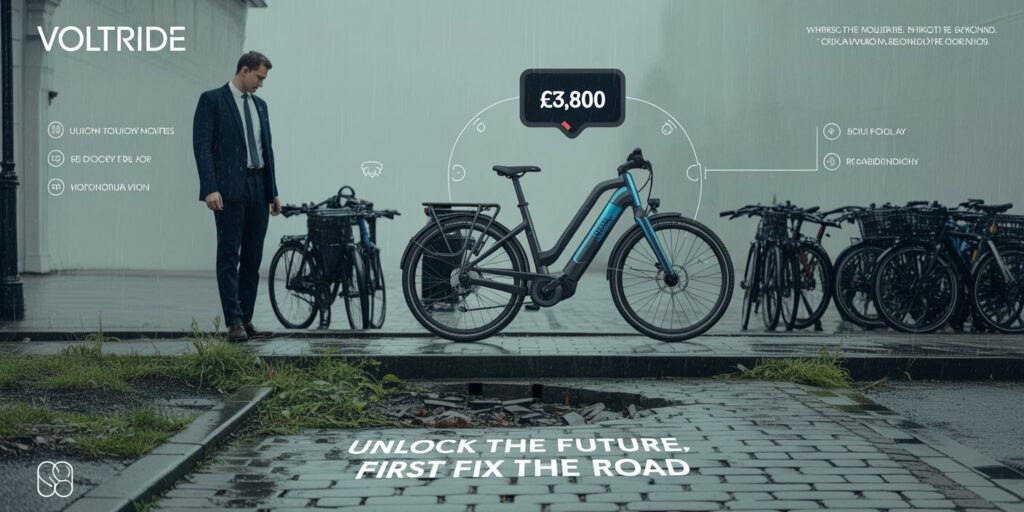
Infrastructure Limitations
While urban infrastructure continues to improve, significant gaps remain:
Urban Challenges
- Inconsistent quality of cycling infrastructure between boroughs
- Limited secure parking facilities for high-value e-bikes
- Workplace charging facilities are still rare
Rural Challenges
- Minimal dedicated cycling infrastructure
- Limited public charging options for longer journeys
- Higher average speeds on rural roads create safety concerns
Battery Sustainability Concerns
As the e-bike fleet grows, end-of-life battery management is becoming a more pressing issue:
- Only 52% of UK e-bike batteries currently enter proper recycling streams
- Limited consumer awareness of battery recycling requirements
- Developing collection infrastructure, struggling to keep pace with market growth
- Emerging battery passport schemes to improve traceability and recycling rates
The industry is responding with manufacturer take-back schemes and improved consumer education, but a comprehensive national approach remains a work in progress.
Conclusion: The Road Ahead for UK E-Bikes
The electric bike market in the UK stands at a pivotal moment in 2025. After weathering challenging economic conditions and perception issues, the sector is showing clear signs of renewed growth and mainstream acceptance. With sales projected to reach 165,000 units this year and continue growing at double-digit rates through 2027, e-bikes are firmly establishing themselves as a legitimate transport solution rather than a niche product.
The environmental and economic benefits of e-bike adoption are becoming increasingly quantifiable, strengthening the case for both individual consumers and policy support. As battery technology continues to improve, prices gradually decrease, and infrastructure develops, many of the traditional barriers to adoption are steadily being addressed.
While challenges remain, particularly around affordability, regulation, and infrastructure, the trajectory is clearly positive. The UK may still lag behind European leaders like Germany and the Netherlands in adoption rates, but the gap is narrowing as British consumers increasingly recognise the practical benefits of electric bikes for both urban mobility and leisure pursuits.
Experience Electric Bikes Firsthand
Join us at one of our 2025 Electric Bike Demo Days across the UK. Test ride the latest models, speak with experts, and discover which e-bike is right for your needs.
